
A phantom? A ghost? Well, yes but they are not very scary ... because these are very particular ghosts. We call it spectra. You've all seen a rainbow: well, colored light
of this wonderful natural phenomenon is precisely the light spectrum of sunlight that breaks down into all its components, which in scientific terms we call "wavelengths".

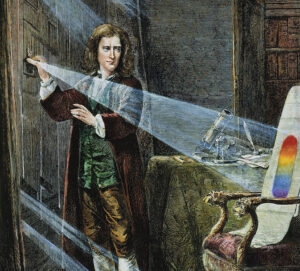
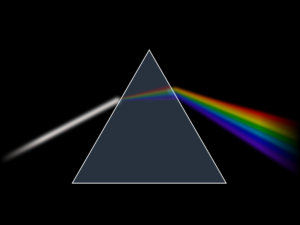
It was Newton around 1665 who gave the name "spectrum" (because evanescent, almost spectral light) to this phenomenon, in one of his most famous experiments, using a triangular prism through which he passed the light of the sun, first filtered by a thin slit.
It is not the only way to diffuse light, to form a spectrum: today we can use more sophisticated objects such as diffraction grids or grisms, a mix of prisms and grids.
In astrophysics, spectra are FUNDAMENTAL for knowing the chemical compositions of what you are observing: without them we would not be able to know what stars, galaxies and many remote objects are made of that we cannot analyze with our hands, for example in laboratory.
It is for this reason that, in addition to classic astronomical photographs, I wanted to build myself a spectroscope, for a spectral analysis of celestial bodies. Be aware that these tools can also be purchased, and of very high precision. But I must admit that the taste of do-it-yourself, a deadly mix of "know-how", of learning in the field and of deep knowledge of those who have already done something similar, ultimately provides a satisfaction that goes far beyond what is possible to do with a purchased tool.
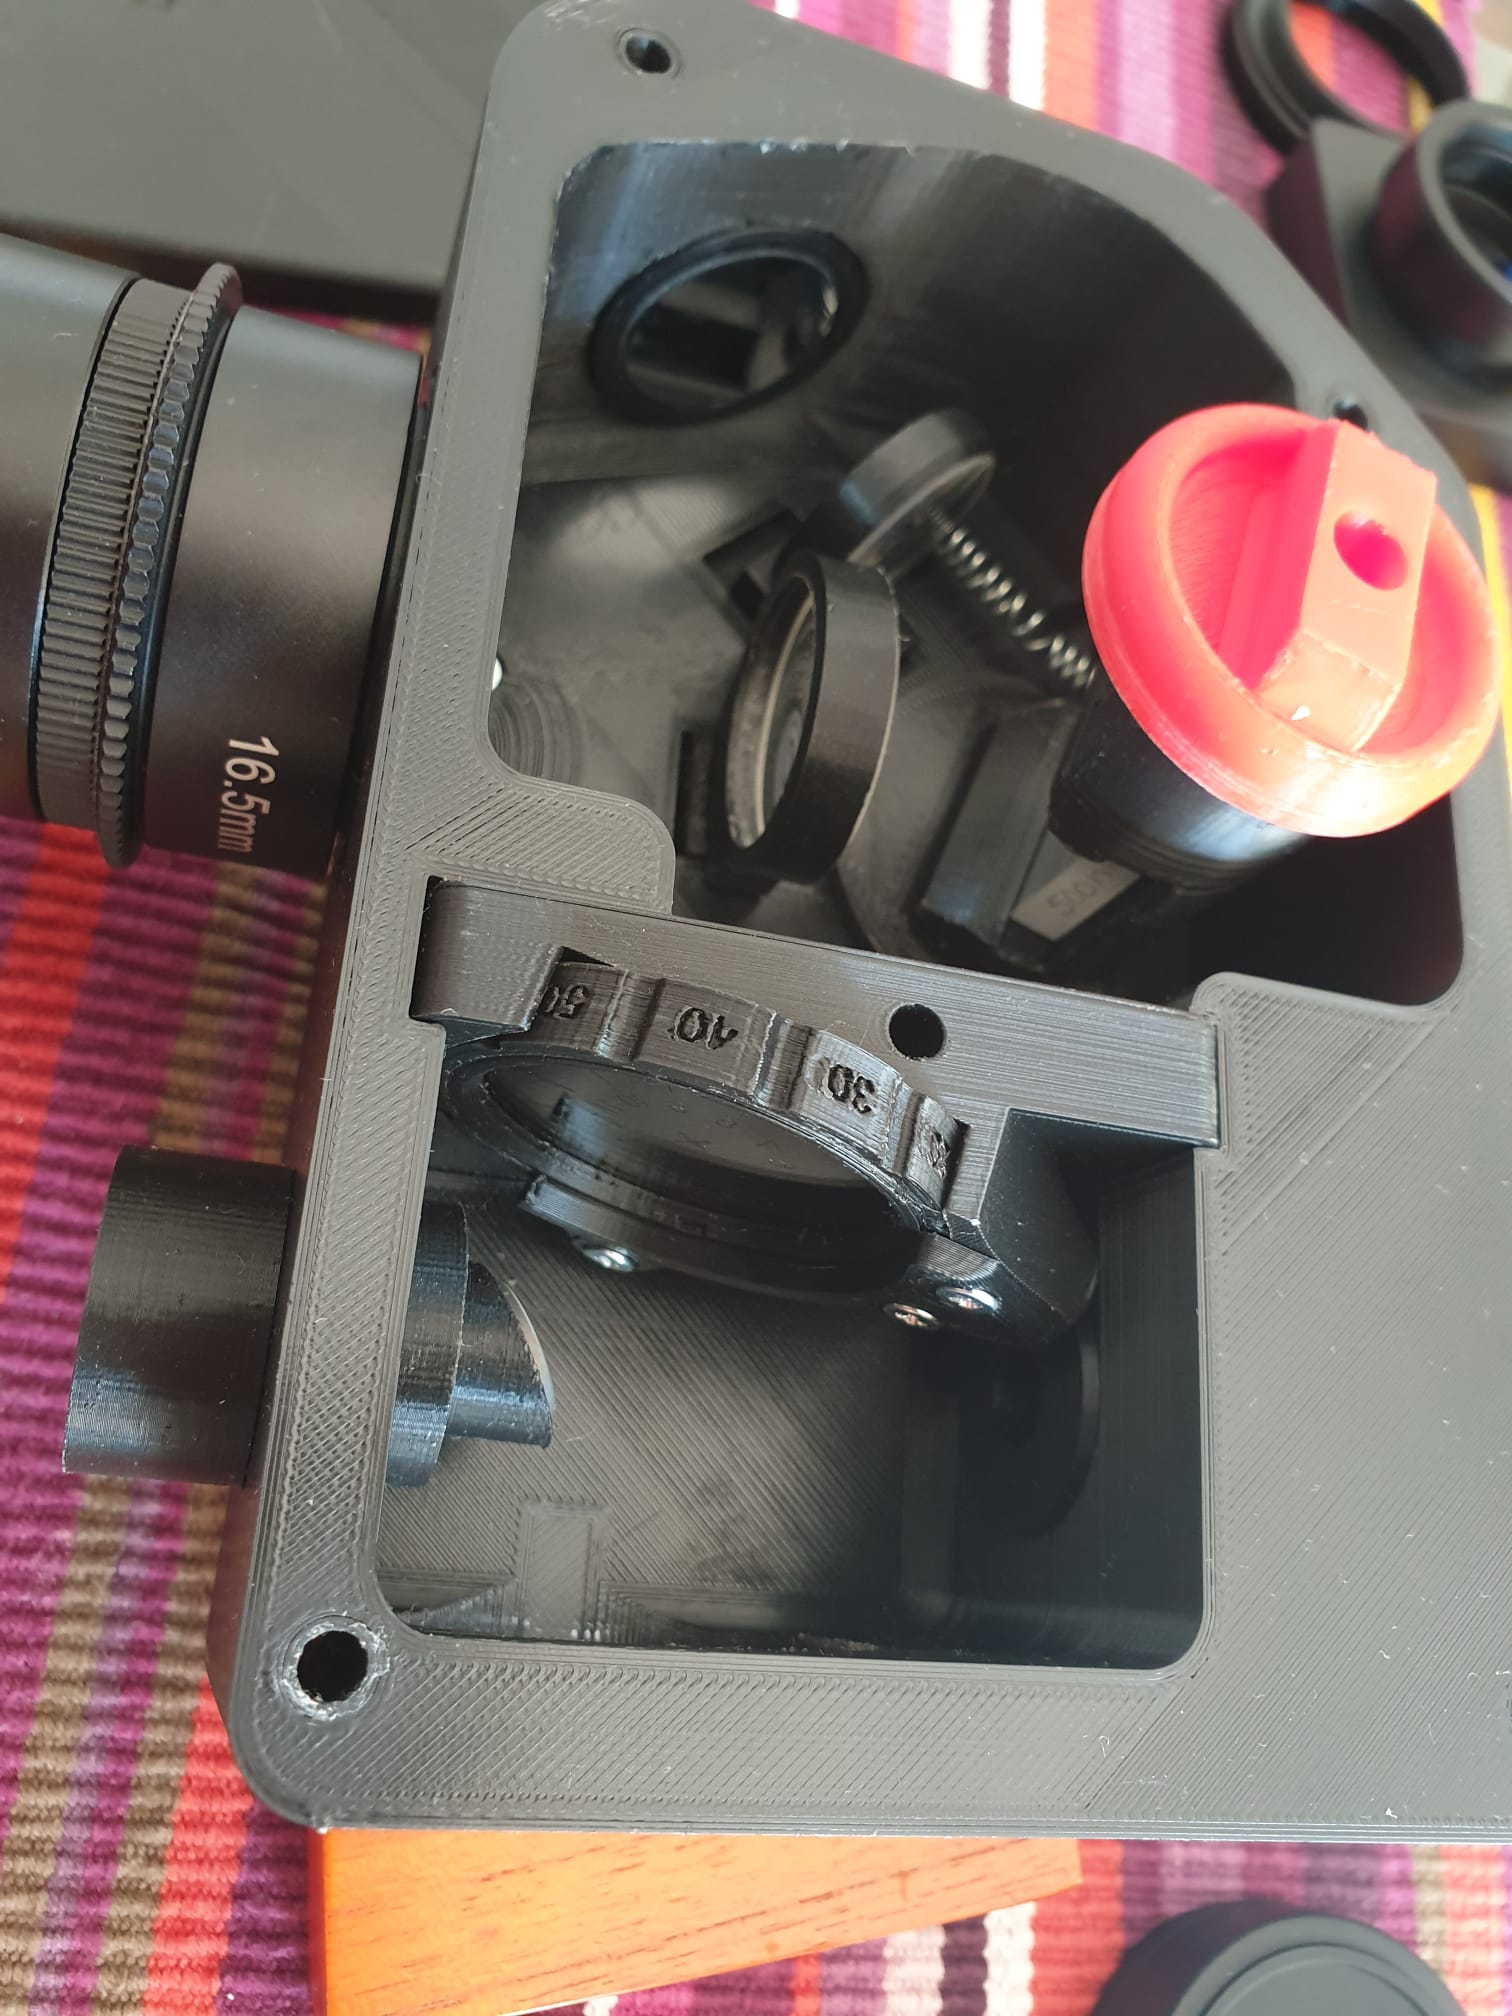
So let's start from the beginning, from the project. I used the "do it yourself" LOWSPEC v3 spectroscope, designed by Paul Gerlach which I printed with a 3D printer, a Creality Ender 3. You can find all the 3D files, instructions and many examples on the website https://www.thingiverse.com/thing:2455390
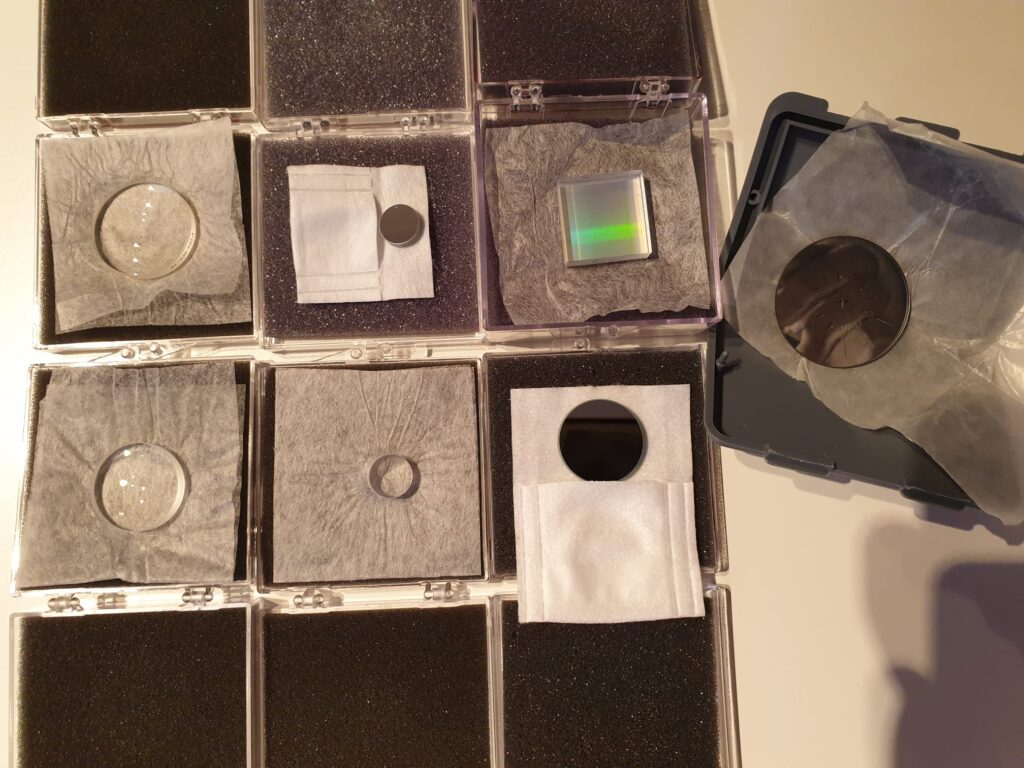
In addition to printing the pieces with a 3D printer, you will need to get some "hardware" material (screws, bolts, etc.) and some optical parts. But the project lists all the necessary pieces and also the links to the sites where to buy them. See the images to understand more or less the complete material needed for its construction.
This instrument can give many satisfactions in the didactic and astronomical field in particular, for the in-depth analysis of stars, planets, supernovae, nebulae, etc.


Obviously the greatest satisfaction, as already said, comes from its construction, basically quite simple, with a final cost of about €4-500, therefore much lower than a commercial spectroscope with the same characteristics. It is possible to install various gratings, which can be replaced with a simple "screw/unscrew" of the piece. The resolution of the diffraction grating I purchased is 600 l/mm (you can also begin with 300 l/mm to start), which can also be upgraded up to 1800 l/mm for a spectral resolution of even R = 5 -6000.
I will not describe the construction process, which you find in Paul's detailed instructions, rather some of the results obtained.
But let's come first to understand what a spectrum can tells us.
First of all you acquire the actual spectrum with the spectroscope attached to the telescope - I use a Celestron C6 at f/10, which is the ideal focal ratio for this type of instrument.
The spectroscope, as already explained, has a diffraction grating inside which breaks up light into all its "colors" or wavelengths. This image is acquired like a normal astronomical photograph, perhaps with multiple separate poses, also using darks and flat frames.

If you look closely at the image of the spectrum above (spectrum of the Sun), you will notice dark vertical lines: these are called absorption lines. Their position on the spectrum indicates exactly the chemical element that is absorbing the light in the direction of the observer. Seeing an absorption line therefore means "discovering" a chemical element or molecule present in the observed object. I won't go into the details of the physical causes of the absorption process but if you're curious, ask!
The next step is to analyze the image acquired using software (I use a free program called BASS project - https://groups.io/g/BassSpectro) creating a 1D graph (see the figure below). In these graphs it is possible to better analyze the absorption lines (which in some cases can also be emission, i.e. with peaks pointing upwards), finding the exact position and measuring the flow (height) and possibly the width, parameters that can also indicate the quantity of elements present in the observed object.
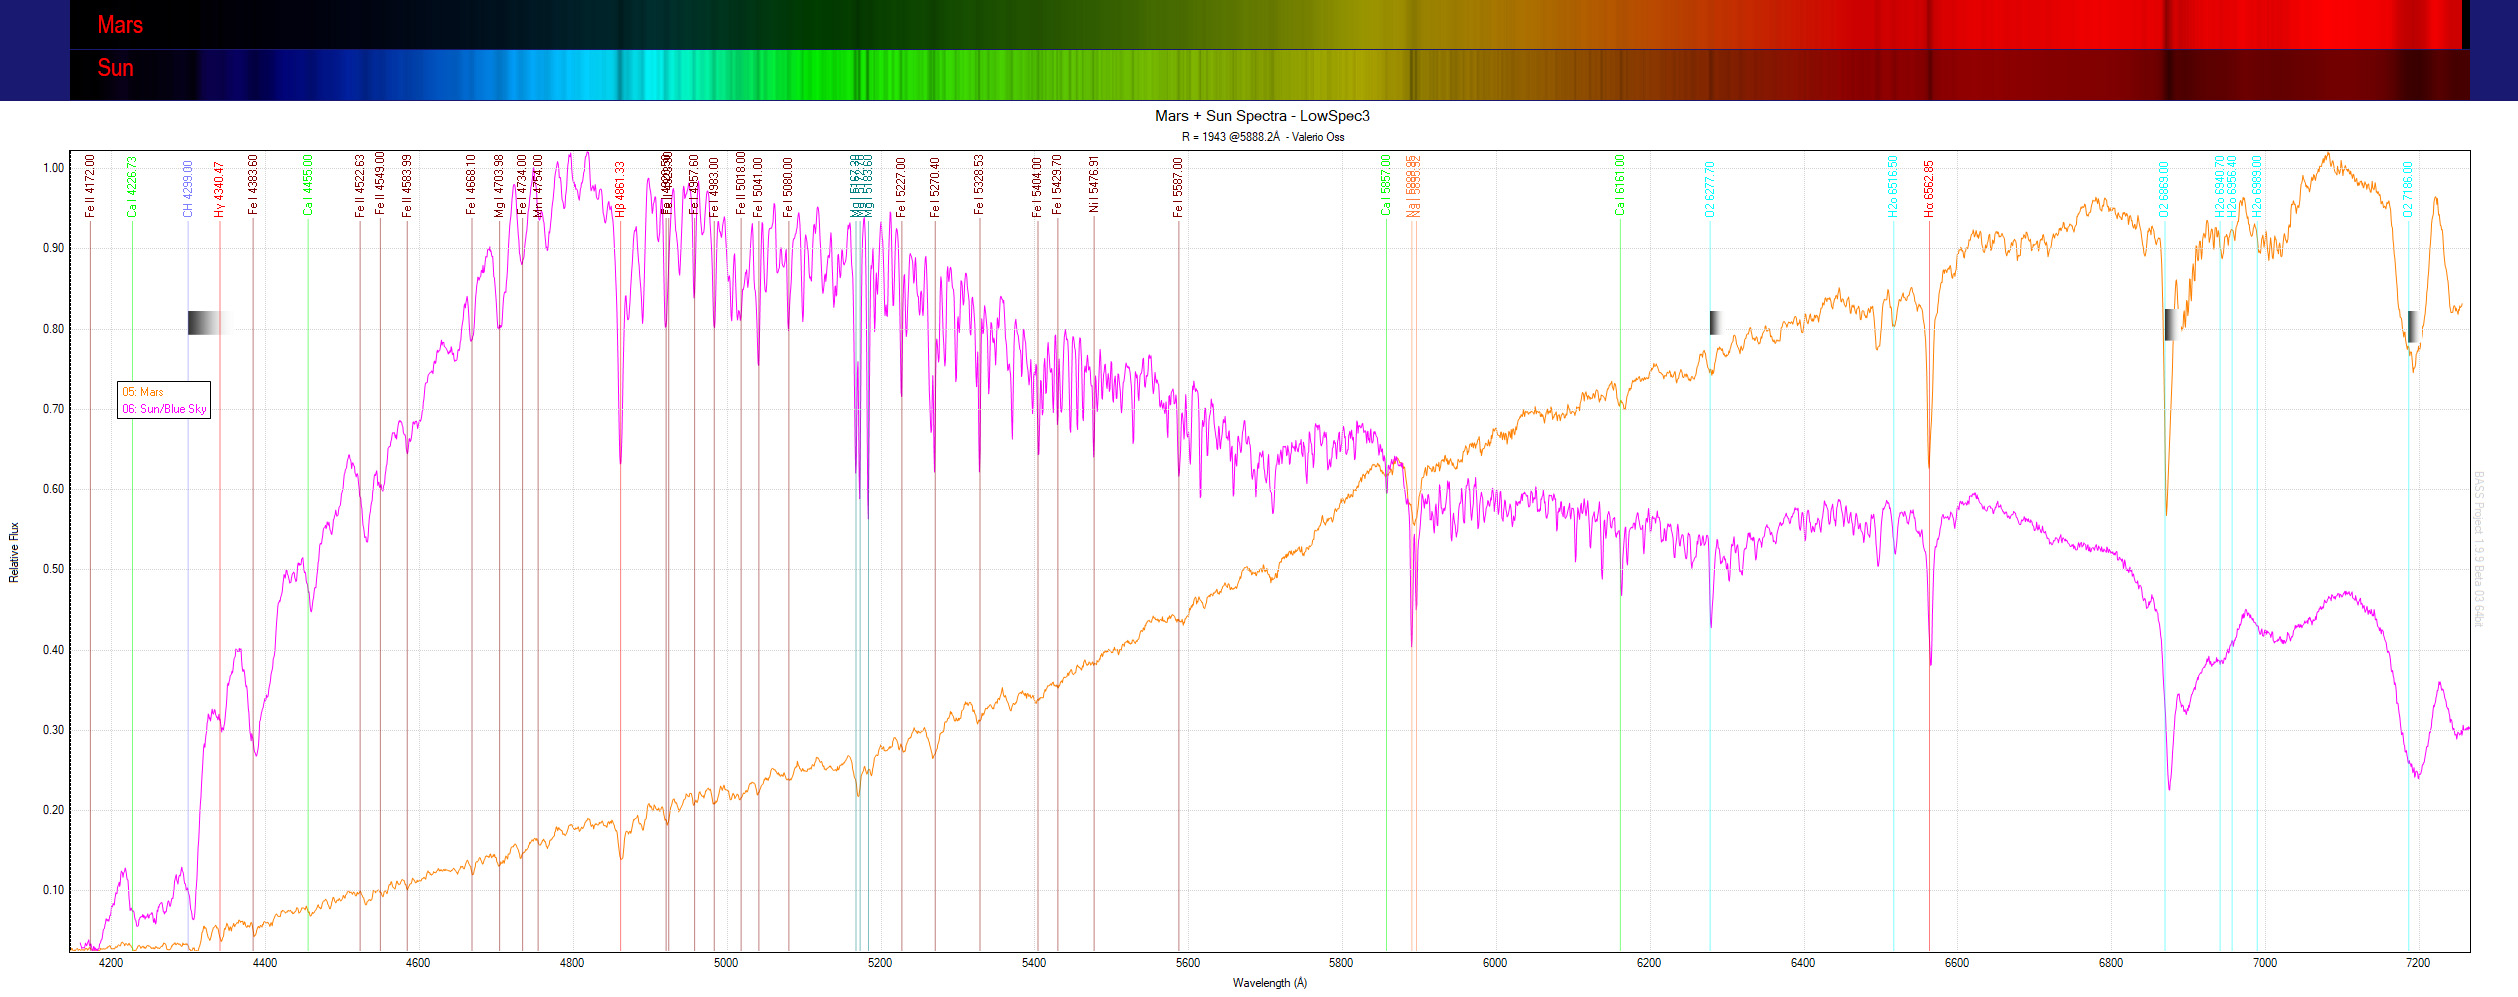
Among the first spectra acquired, the "simple" solar spectrum (actually framing the blue sky) and in comparison the spectrum of the planet Mars. As you can see, the planet shows practically all the absorption lines of the solar spectrum, being a body that reflects and does not produce its own radiation. There is some small trace of Ne (neon) and perhaps Ar (argon) in addition but very little visible while the most evident features of the carbon dioxide CO2 present in the planet's atmosphere are unfortunately located in the near and medium infrared, not framed by this shot more centered on the visible.
Another example is the spectrum of the planet Uranus.
As you can see from this graph, there are depressions (sometimes more sometimes less evident and narrow) which are the absorption lines: they are dark lines on the rainbow background (the so-called continuous) which as mentioned indicate exactly the element which is absorbing light in the direction of the observer.
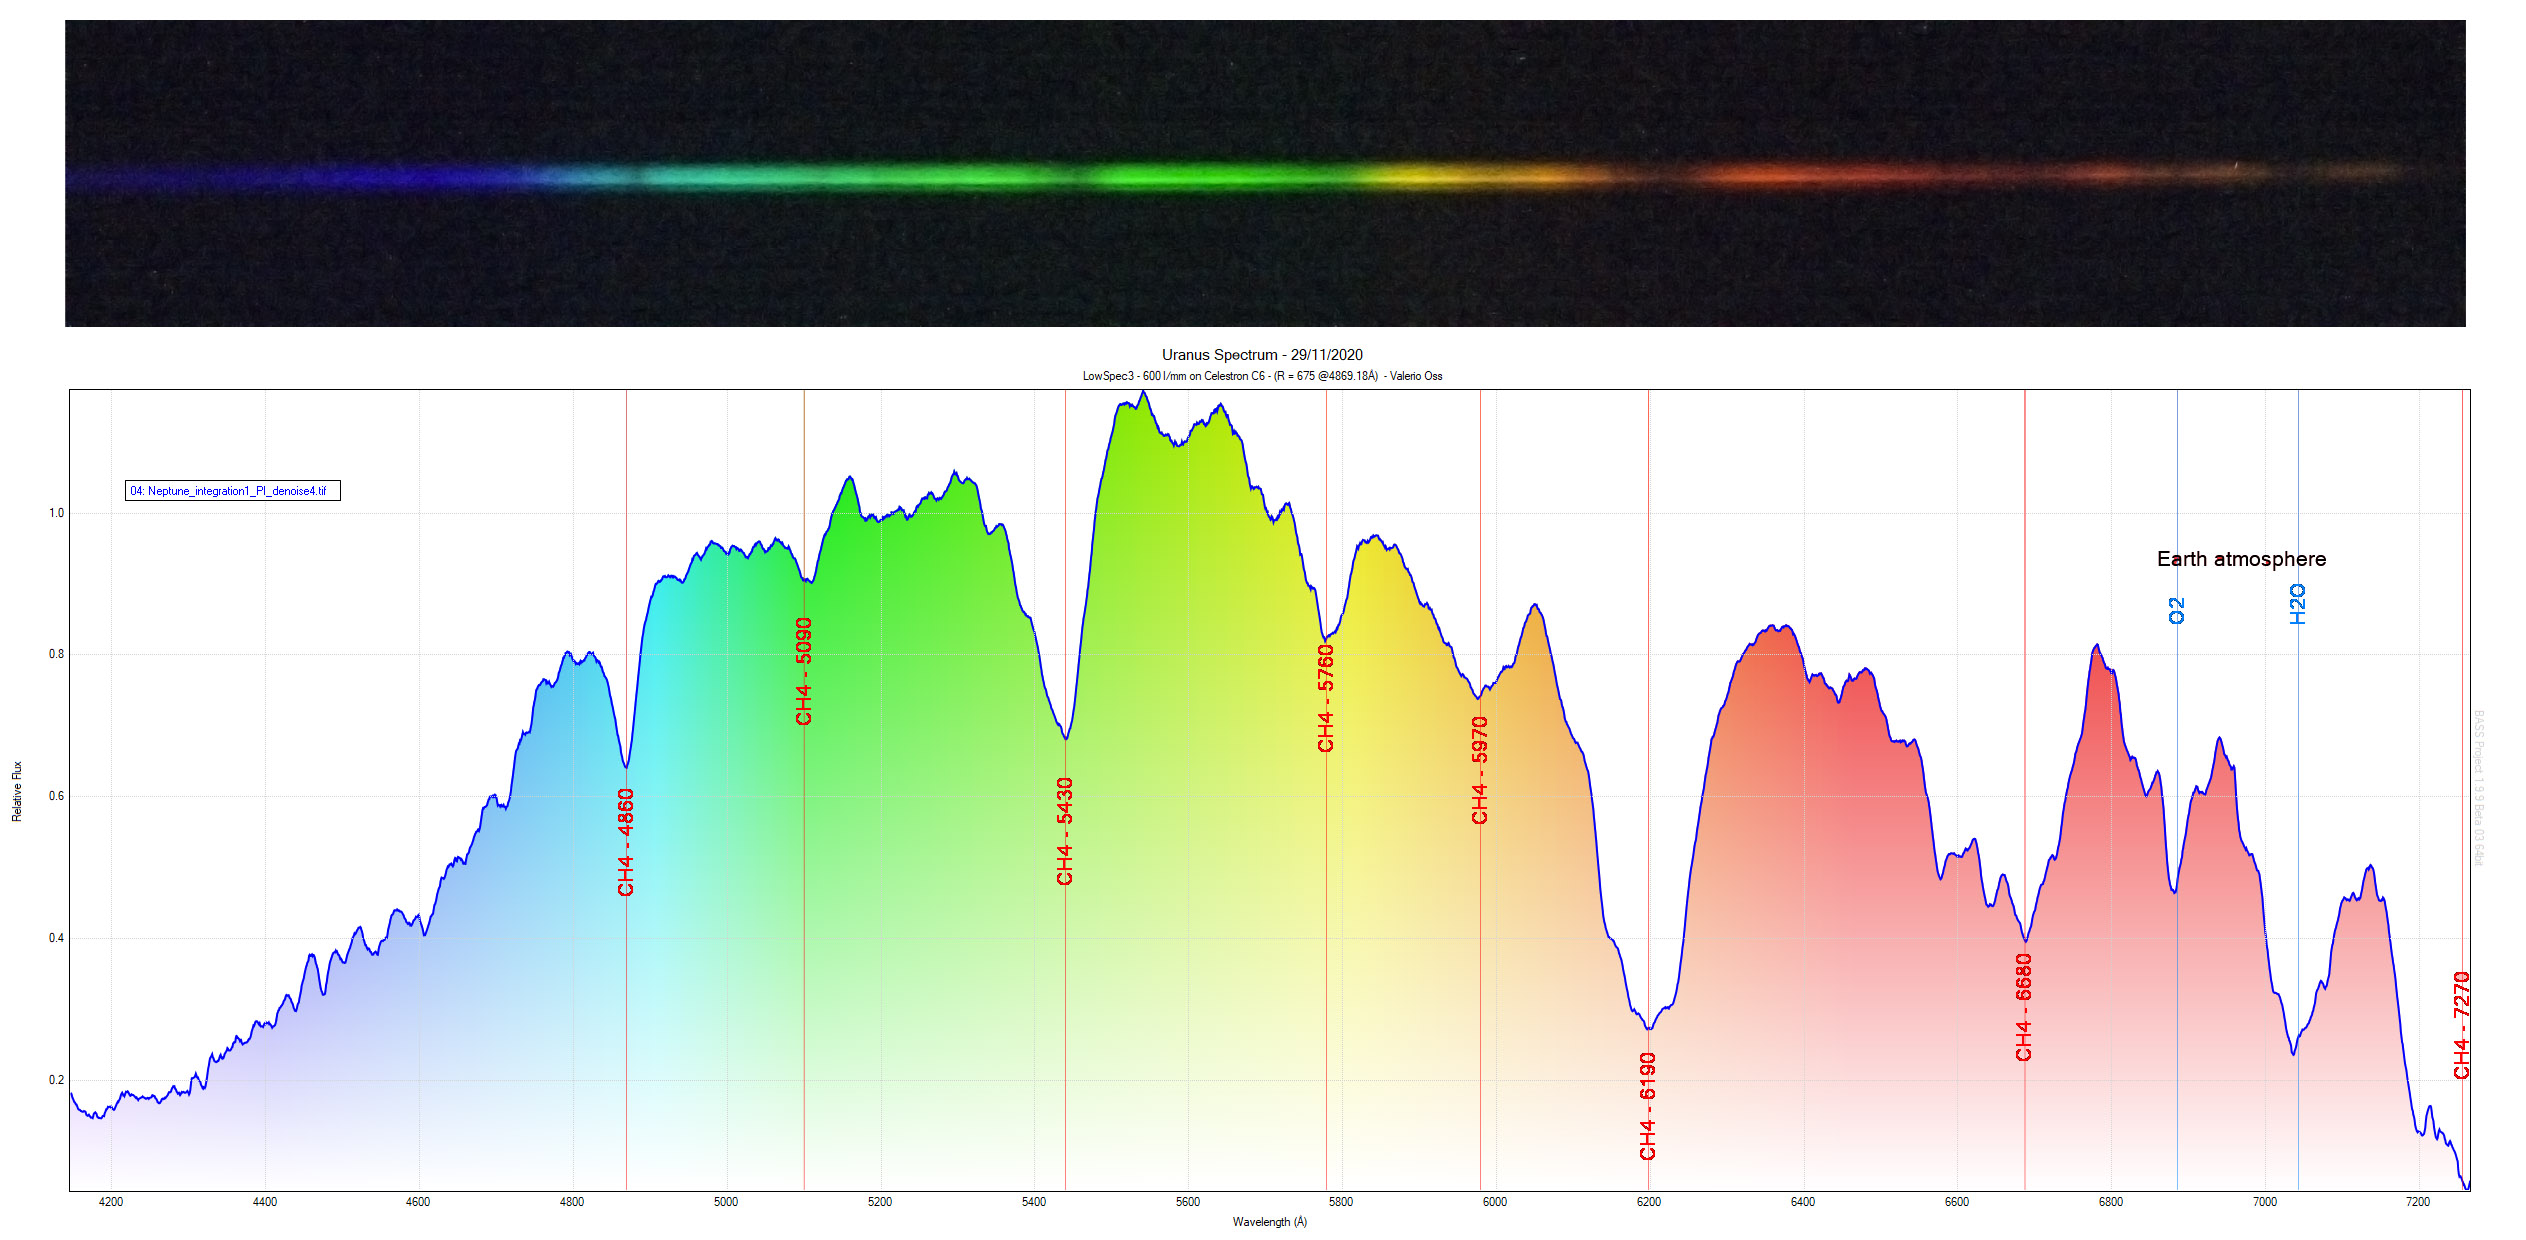
In the example of Uranus you see the presence of CH4, that is methane, which in fact makes up a large part of the planet's atmosphere. The continuum curve represents the light reflected by the sun, which is missing some lines (in this case very wide, they look more like valleys, also due to the resolution of the instrument used): the methane present in the planet's atmosphere has absorbed part of the light coming from the sun, reflecting only a part of it, missing from the elements present in the atmosphere.
But how do we know which elements these lines correspond to? By making measurements in the laboratory, we obtain spectra from known chemical elements and thus know where exactly all the chemical elements of the periodic table are located. It is not so simple for the more complex molecules: today we know more than 200 of them, but the position of the lines of as many is still unknown.
Building this spectroscope can be difficult (for schools for example). In a future article I will propose a much simpler tool, to be built in the classroom and experimented with the children.
I hope that my work has opened your eyes to the colors of the rainbow.
Understanding the spectra is in fact essential to understand the universe.